

Custom Graphs and Charts
Once you've extracted some meaningful trends from your data, the next step is to present your findings to decision-makers. Zarca allows anyone to quickly generate sharp, eye-catching visuals that look like they took hours to design. Deliver more effective presentations that drive your message home with our suite of custom graphs and charts.
Click this graph to view more Report presentation options
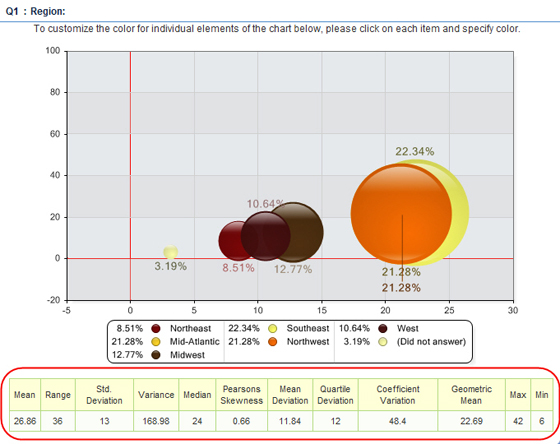
Apply Statistics
In addition to the basic statistics available in our Statistical Report, you can dig for deeper relevance using a range of various statistics like coorelation coefficient and standard deviation.
In addition to the basic statistics available in our Statistical Report, you can dig for deeper relevance using a range of various statistics like coorelation coefficient and standard deviation.
Apply 3D Graphics
Once you've extracted the critical insights and are ready to share your findings, it's important not to overlook the aesthetic appeal of your presentation. To engage your audience visually, apply 3D graphics and sharp, customizable color schemes.
Once you've extracted the critical insights and are ready to share your findings, it's important not to overlook the aesthetic appeal of your presentation. To engage your audience visually, apply 3D graphics and sharp, customizable color schemes.
Email Dynamic Reports
Share findings with your organization's decision makers in a flash using dynamic email reporting.
Share findings with your organization's decision makers in a flash using dynamic email reporting.
Merge Survey Data
Support year-to-year studies and multi-modal surveys by combining reports of different surveys into one aggregated analysis.
Support year-to-year studies and multi-modal surveys by combining reports of different surveys into one aggregated analysis.
Save Reports
Archive your reports for quick reference right when you need it.
Archive your reports for quick reference right when you need it.