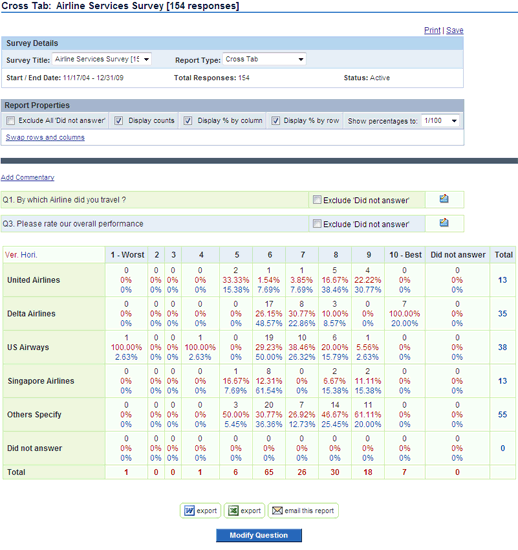
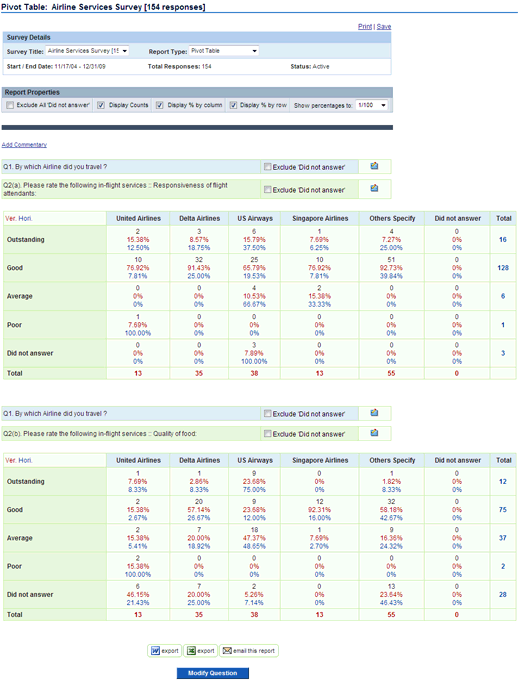
Drill-Down into Survey Data
Pivot Tables and Cross-Tab reports display survey data as counts
(frequencies), percentages by column, percentages by row, or some
combination of these options. Users can also specify the number of decimals
that appear with the percentages down to zero and are able to add commentary
to help guide viewers of the report.
With these reports, you can mix and match counts and percentages to create
the best view of the data. For example, when there are many responses, it is
quick and easy to analyze data only by percentages. Likewise, when there are
relatively fewer responses, it is more straightforward to simply look at the
counts.
Sample Pivot Report with Counts and Percentages
Sample CrossTab Report with Counts and Percentages