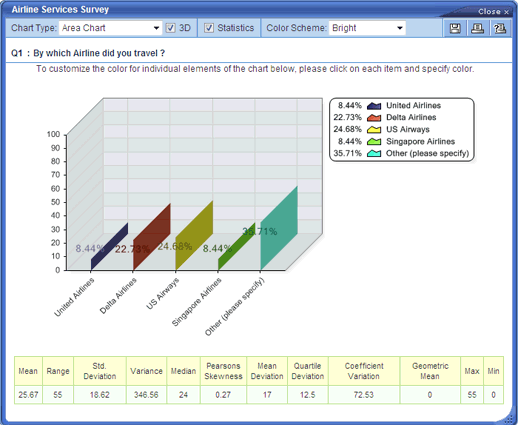
Similar to the Vertical Bar Graph, the Area Chart shows survey results
along the X-axis. The only difference is that the bars are much thinner and
have a more angular look and feel.
+Attributes
- View in 3D
- Advanced Statistics
- Percentages
- Bar graph legend
- Custom color schemes


